Claude AI launches interactive visuals feature, transforming how chatbots explain complex concepts
14 Sources
14 Sources
[1]
Claude Showed Me How to Change a Tire Step by Step With This New Feature
Blake has over a decade of experience writing for the web, with a focus on mobile phones, where he covered the smartphone boom of the 2010s and the broader tech scene. When he's not in front of a keyboard, you'll most likely find him playing video games, watching horror flicks, or hunting down a good churro. Claude can create interactive charts, diagrams and visualizations directly in the chat using a new feature Anthropic announced Thursday. The new tool, which is currently in beta (so expect bugs), is no AI image generator. It's not a Nano Banana rival, but something completely different. In fact, you really need to see the feature to get an idea of how interesting and clever it is. I tried the new feature by asking Claude to show me how to change a tire, and it produced a thorough, interactive step-by-step visualization that made me confident I could handle the task. It wasn't just a cool trick (though it was cool); it was a better way of showing the process than the typical block of text from an AI chatbot. These new visualizations have a specific purpose: to give users a better understanding of the subject they're discussing with Claude. In some cases, a large block of text can be more clearly replaced with a visual, which is what Anthropic, Claude's maker, is trying to do here. The system determines when a visual might be the most appropriate response in a conversation so the information can be more easily understood. Among the more interesting examples Anthropic shared are a step-by-step tutorial for making a "cool" paper airplane and an interactive periodic table that lets you click on individual elements for more information. When Claude determines that a visual is the most appropriate response -- or when a user explicitly asks for one -- it generates interactive HTML and SVG files on the spot, built from scratch. Anthropic likens the feature to giving Claude an on-demand whiteboard. The feature is part of a broader push by Anthropic to make Claude a more dynamic AI tool that can choose the best medium for delivering an answer. Even without a traditional image generator, the capability may be more impactful, providing visualizations when they're most useful. The feature will be turned on by default, so no need to click through settings to enable it. Plus, it's available on all plan types, meaning you won't be paywalled to access it. It's currently only available for web and desktop and could come to mobile in the future. To see how the feature worked, I asked Claude to show me how to change a tire visually. Within seconds, it produced an interactive seven-step illustration of the process, complete with the tools required and explanations of the key steps. The illustrations weren't highly detailed, but they clearly got the point across. For fun, I also asked Claude to create an interactive, visual representation of the front of a house from a book I was reading. Not only did it do this accurately, but virtually everything was clickable, showing small tidbits of information when selecting the windows or the door. The feature has a real "wow" factor, and you can download the illustrations it generates or save them as artifacts for later use in Claude.
[2]
Claude charts a new course with charts, of course
Conversations with Anthropic's models may now be accompanied by interactive apps Seeing is believing, or so it was said up until AI required questioning everything. But even when braced to resist the slop roulette of online interaction, pictures are worth a thousand tokens. Anthropic's Claude AI model has been trained to do what may be more valuable than mere depiction: It can now generate not just static charts but dynamic visualizations, complete with sliders, buttons, and assorted animation control gewgaws. Anthropic showed off an early version of this capability last fall under the label Imagine with Claude and has now rolled it out to customers as a beta service. "Claude can create custom charts, diagrams and other visualizations in-line in its responses - and then tweak and modify its creations as the conversation develops," the company explains in a blog post. This is not artist style pilfering along the lines of Google's Nano Banana or Midjourney. Rather its on-the-fly generation of JavaScript code using visualization library Chart.js, HTML, CSS, and whatnot. These are on-demand mini-apps, and they're intended to be temporary rather than persistent tools like Claude Artifacts. As an example, Antropic suggests you can ask Claude to show you how compound interest works. And after some churning of bits, the company's AI service will emit an interactive chart with sliders that illustrates said financial miracle. In the before-times, one might have had to scour the web for such a tool and visit various ad-strewn spamscapes before finding a workable option. More interestingly, these just-in-time charting tools can evolve with conversations - after testing out the suggested "Show me how compound interest works" prompt, The Register requested the addition of an inflation slider. And lo, it was done, all for the very low cost of a few thousand tokens and some undisclosed amount of electricity and water. Just for fun, we asked Claude, "Show me an interactive table of elements but instead of elements, depict idiots." To our surprise, Claude, so often playing the role of the responsible one in a cast of more mercenary models, complied with gusto. The chart includes 36 elements detailed in popup windows, starting with 1 Ob, Obviousman. The entry reads, "States the blindingly obvious with the confidence of a Nobel laureate. Will inform you it is raining while you are both standing in the rain." As a rehash of things people have complained about on the internet, wrapped in interactive graphic packaging, it's not bad. According to Anthropic, interactive chart generation is now on by default. ®
[3]
Claude AI can now explain concepts with interactive visuals
The capability is available to all Claude users including free accounts in beta, following ChatGPT's recent addition of similar interactive visualization tools. According to a recent blog post, Anthropic has added a new feature to Claude that enables the AI chatbot to generate interactive visuals like charts, diagrams, and illustrations within its responses. The feature is designed to help users better understand concepts mentioned by the AI chatbot through visual explanations, such as step-by-step images showing how something works. The feature is available to all Claude users, including free users, but is being released as a beta version and is not yet available in mobile apps.It comes shortly after ChatGPT gained its own support for interactive visualizations for science and mathematics.
[4]
ChatGPT and Claude are evolving from chatbots into interactive learning tools - 9to5Mac
This week, both Anthropic's Claude and OpenAI's ChatGPT were updated to embrace learning through interactive visualizations. Both moves show how AI is evolving from the initial chatbot phase to something more mature and helpful. On Tuesday, OpenAI released a blog post called "New ways to learn math and science with ChatGPT" that explains how users can "explore concepts with interactive visual explanations." Today, we're making learning these concepts in ChatGPT even more interactive with new dynamic visual explanations. Starting with more than 70 core math and science concepts, ChatGPT will guide learners by showing how formulas, variables, and relationships behave in real time. These experiences will be available globally across all plans starting today. [...] Now when someone asks ChatGPT about one of the core topics, it can explain it and present an interactive visual module. Users can adjust variables, manipulate formulas, and instantly see how those changes affect graphs and outcomes -- turning abstract equations into something they can experiment with directly. OpenAI highlights specific areas of expertise for ChatGPT's interactive learning feature: Today, the list of math and science topics is most relevant to high school and college age learners, and includes topics like binomial square, Charles' law, circle area, circle equation, compound interest, cone surface area, cone volume, Coulomb's law, cylinder volume, degrees of freedom, difference of squares, exponential decay, Hooke's law, kinetic energy, lens equation, linear equation, Ohm's law, period-frequency relation, potential energy, PV = nRT equation, Pythagorean theorem, slope-intercept form, surface area of sphere, triangle area, trig angle sum identity, and others. While OpenAI is starting with math and science, the company says it plans to expand to additional subjects in the future. Meanwhile, Anthropic announced on Thursday that Claude will no longer rely primarily on text responses. Instead, the AI chatbot has learned how to create interactive charts, diagrams, and visualizations. Last fall, we previewed Imagine with Claude: a new way for Claude to build visuals in real time, without any code. We're now bringing a version of this feature, in beta, to Claude's chat conversations. Claude can create custom charts, diagrams and other visualizations in-line in its responses -- and then tweak and modify its creations as the conversation develops. Anthropic says the new feature is on by default, and Claude will automatically decide when to use visual responses. Both chatbot updates show how both AI systems are maturing and moving beyond the text-only interface that kicked off the modern large language model revolution.
[5]
Claude added immersive visuals to chats in real-time, currently in beta
Claude is expanding on one of its coding tools to bring immersive visuals like charts and graphs to chats, all built in the moment to present responses to complex questions. AI models have proven they can be useful at answering complex questions, but a lot of the value falls apart when answers are presented as basic text. Yes, formatting matters, but nothing beats a good old chart. Anthropic announced Claude's latest feature in beta - responses with interactive visuals and charts. In a video announcing the feature, Claude's new visual system is incredibly impressive. A couple of examples are highlighted, like a quick one-sentence answer to a question followed by a complex idea map filled with information and dropdown boxes. Instead of a text-ridden answer, the response appears a little more inviting. In another example, Claude answers a question about structural weight distribution with a visual chart, complete with directional icons and a legend for easy comprehension. Anthropic says that Claude's visual responses will update in real-time as the conversation develops. This is something other models, like Gemini, do to previous responses as the user adds more details, though nothing seemingly as visually complex as what Claude added. Some responses will be interactive. Claude notes users will be able to click certain portions of charts and graphs, with underlying information surfacing after. This comes as Claude recently announced format-specific answers, like recipes that favor a very specific structure for easier comprehension. The company notes that Claude's new visual answers are available now for all plan types, though the feature is only being released in beta for the time being.
[6]
I tried Claude's new interactive visuals feature -- and it's one of the most fun AI tricks I've seen
You can create a vibe-driven outfit picker or the perfect coffee guide with the right prompt Claude's run of new and expanded features continued this week with a new beta feature that lets you create interactive visuals, including charts and diagrams, right inside a chat. These tiny interactive tools let you tweak controls and see the graphics shift to reflect the change. The feature builds on the company's earlier "Imagine with Claude" concept, which experimented with letting the AI construct visual outputs without requiring code. The latest version brings those visuals directly into the conversation itself. Instead of living in a side panel like Claude's artifacts, the diagrams appear inline as part of the response and evolve as the discussion continues. I decided to see how far that idea could go with some prompts that were equal parts useful and slightly ridiculous. 1. Coffee calculations The first prompt was grounded in something practical. I asked Claude: "Make an interactive coffee-to-water ratio calculator. Pick your brew method and cup count and get exact coffee and water measurements." Within seconds, a small interactive tool appeared inside the chat. At the top was a selector for brew method, offering familiar choices such as pour-over and French press. Beneath that sat a simple control that let me choose how many cups I wanted to brew. The clever part was how the display responded. When I switched from one cup to three, the measurements below changed instantly. The visual showed the precise amount of coffee grounds and water required for that brew style. It was the sort of calculation that coffee enthusiasts often memorize or look up online. Seeing it rendered as a little dynamic graphic made the process feel almost obvious. Instead of explaining brewing ratios with text, the chatbot had quietly built a tiny barista tool inside the conversation. 2. Volcano fun For the second test, I wanted to see how Claude handled an educational task. I asked it to: "Show an interactive cross-section of a volcano with labeled parts. Animate the parts when I toggle an eruption." Claude responded with something that looked like a digital page torn from a science textbook. The volcano appeared sliced open from the side, revealing its inner structure. When I toggled the eruption control, the magma chamber lit up and animated upward through the conduit like glowing lava rising toward the surface. Switching the eruption off returned the mountain to its dormant state. The whole thing felt like a miniature geology lesson assembled in real time. 3. Vibe dresser The third experiment leaned fully into absurdity. I asked Claude to: "Build a vibe-based outfit generator. Pick a temperature and a vibe and generate a very specific outfit suggestion with a stick figure model." Claude responded with the kind of interface that might appear in a very strange fashion app. At the top sat a temperature slider ranging from chilly to sweltering. Beneath it were several vibe buttons. Selecting a combination generated an outfit for a tiny stick-figure model. When I chose a cooler temperature and the cozy vibe, the stick figure appeared bundled in what looked like an oversized sweater and thick socks. When I shifted the vibe to chaotic, the outfit became dramatically less sensible. The stick figure wore clashing colors and sunglasses, suggesting someone who had made bold decisions before leaving the house. The text description next to the figure explained what to wear and the vibe it might project. The little figure updated every time the controls changed, making it oddly tempting to keep experimenting with different combinations. None of these examples is likely to change the world on its own, but how Claude created them is pretty impressive and quite fun. The approach hints at how chatbots might communicate small visual demonstrations on the fly. The visuals are deliberately temporary, but the fleeting quality makes them feel less like sketches drawn during a conversation, and it could really draw in more potential users. At least that's the vision Claude is hoping to sketch out. Follow TechRadar on Google News and add us as a preferred source to get our expert news, reviews, and opinion in your feeds. Make sure to click the Follow button! And of course you can also follow TechRadar on TikTok for news, reviews, unboxings in video form, and get regular updates from us on WhatsApp too.
[7]
Claude's responses get interactive inline visuals to help you understand complex topics faster
Anthropic is adding support for inline visuals, allowing Claude to generate interactive charts, diagrams, and more in its responses. Anthropic is rolling out a significant upgrade to its AI assistant Claude, adding support for inline visualizations in responses. Instead of relying solely on text explanations, Claude can now generate charts, diagrams, and other interactive visualizations directly within the conversation. What can Claude's new inline visualizations do? According to Anthropic, the new feature builds on Imagine with Claude. Previewed last year, this experimental tool lets users create interactive software in real time without writing any code. The company has now integrated a version of that capability into Claude's responses. Thanks to this, it can now automatically generate interactive visualizations when explaining data or concepts. Recommended Videos Anthropic explains that these visualizations are dynamic, meaning they update as the conversation evolves. Users can also manually tweak or expand them as needed, and interact with them to get a better understanding of the topic at hand. When will Claude use visualizations in its responses? The feature is enabled by default across all plan types on the web and desktop, with Claude automatically deciding when a visual might help elevate its response. Users can also request one directly with prompts such as "draw this as a diagram" or "visualize how this might change over time." Anthropic says the feature reflects a broader shift for Claude. Rather than defaulting to text for its responses, the assistant is learning to choose the best format based on the task, the data, and the user's needs. It follows an upgrade introduced earlier this year that gave Claude the ability to use purpose-designed formats for certain topics. Recipes, for example, now appear with clearly separated ingredients and steps, while responses to weather-related queries include a visual. Claude also picked up support for interactive apps in January, allowing users to perform actions within apps like Slack, Figma, Asana, Canva, and more directly in the chat interface.
[8]
Claude now generates charts and diagrams to explain complex data
Anthropic introduced a feature for its Claude chatbot that generates charts and diagrams within responses. The update allows Claude to create visuals either when directly requested or when it determines they might aid user comprehension. This release follows a similar update from OpenAI for ChatGPT. The development intensifies competition in the artificial intelligence sector regarding visual explanation tools. By providing graphical aids, the feature aims to improve how users understand complex instructions or data. This positions Claude as a more versatile tool for educational and professional tasks. Anthropic stated that the feature is not image generation. Instead, Claude produces visual aids using HTML code and XML vector graphics. The company described this capability as giving the chatbot access to its own whiteboard. The feature is available to all users, including those on free subscriptions. Anthropic warned that the software is in beta and may contain quirks. The capability is not yet supported on mobile devices. This release occurs days after OpenAI updated ChatGPT to generate interactive visuals for science and math concepts. Anthropic is previewing this update to make its chatbot better at explaining concepts. Claude is a large language model developed by Anthropic. The company focuses on AI safety and research. Anthropic is based in San Francisco.
[9]
I tried Claude's new interactive visuals and they might be it's coolest feature yet
Mahnoor Faisal is a tech journalist covering AI and productivity tools with bylines at XDA, SlashGear, MakeUseOf, Laptop Mag, and Android Police. She's been writing professionally since she was sixteen, and has since penned hundreds of articles. This includes in-depth coverage of AI tools like NotebookLM to breaking news across the AI space. Her passion for technology started when she received her first iPod Touch (4th generation) on her 8th birthday, and she's been deep in the tech world ever since. Currently pursuing a degree in computer science, Mahnoor brings both a journalist's eye and a technical foundation to her coverage of how AI is reshaping the way we work and learn. Anthropic, the maker of Claude, is one of the AI companies that has been particularly prolific lately. The company has been dropping new feature after feature, and it's gotten to the point where keeping up with its launches has become a challenge in itself. People all over social media have been joking about what job Anthropic will announce Claude can do next. In the past few weeks alone, the company announced Code Review, Claude Marketplace, Connectors, Remote Control in Claude Code, and Scheduled Tasks within Claude Cowork. But as a visual learner, the feature drop I find most exciting is one that flew a bit more under the radar: interactive visuals. What are Claude Interactive Visuals? No, this isn't just Artifacts with a new name Anthropic announced Interactive Visuals on the 12th of March 2026 as an expansion of Imagine with Claude, a temporary experience the company showcased in late 2025. The new feature lets Claude generate charts, diagrams, and visual explainers right within the conversation. Claude builds these using HTML, meaning they're not static images, and you can interact with them directly. Custom visual responses are available to all Claude users in beta on the web and desktop. They aren't available on Claude for iOS or Android. If your first thought after reading the above is "doesn't Claude already create diagrams?", that's completely fair. That was exactly what I wondered at first too. Claude has had an Artifacts feature since June 2024 that lets you "turn ideas into shareable apps, tools, or content." For instance, you might have noticed that when you ask Claude to write up an essay, it opens the document in a separate side panel on the right, where you can edit, copy, or download it as a standalone file. That's exactly what an Artifact is. Beyond essays, Artifacts can be code snippets, single-page HTML websites, SVG images, flowcharts, or even fully interactive React components. Related ChatGPT Is Getting Old: Try This Ultra-Smart AI Alternative Instead If you're bored with ChatGPT or want to try something new, Claude is the answer. Posts 1 By Danny Maiorca Unlike Artifacts, which are meant to be standalone outputs, interactive visuals are more conversational. Claude automatically generates them when it determines that a visual would explain something better than text alone. Instead of opening in a separate side panel, visuals render inline right between paragraphs of Claude's responses. So, essentially, you don't need to explicitly ask Claude to create a visual (though you totally can). Unlike Artifacts, visuals live inline within the conversation and are inherently temporary. They change and adapt as you ask follow-up questions, and are simply aids that make the conversation itself easier to comprehend and follow. That said, you can still choose to keep a visual by taking a screenshot of it, saving it as a .svg or .html file, or converting it into an Artifact. A visual thinker's dream come true I've always been the kind of person who understands better when someone shows me rather than explaining it for the third time. If you've ever zoned out when someone's explaining something, or when reading instructions but immediately understood a flowchart, you know exactly what I mean. This feature is the equivalent of someone quickly tearing out a piece of paper to draw a quick diagram while they're explaining something. Except here, the diagram is fully interactive and engaging. Here are a few examples I used to test out the feature: Visualizing Digital Logic Circuits AI has been a massive help when it comes to understanding tricky concepts while studying. As I write this, I have a quiz for one of my courses this semester: Digital Logic and Design. One of the first things I tried with this feature was creating interactive visuals for the course. I first asked Claude, "Hey, how do logic gates work?" and it gave its usual text explanation, with a visual right in the middle of the answer. It was a static visual, though, so I changed my prompt to, "Hey, show me how logic gates work." Sure enough, it built me an interactive logic gate playground with inputs I could toggle to see the outputs change in real time -- pretty impressive! I then asked it to do the same for full adders and half adders (two concepts I was a bit iffy on), and it generated an interactive visual again, paired with the text. Using both, I actually ended up understanding the concepts much better than I would have from text alone. Understanding Matcha grades and preparation Matcha has been my latest obsession. Unfortunately, my wallet doesn't quite like the idea of me ordering a matcha every day. So, I've been looking into making it at home. However, I've been struggling to understand all the different grades, tools, and preparation methods. Given that I haven't had time to conduct proper research or watch YouTube videos about it, I decided to send the following prompt to Claude: I want to start making matcha at home but I'm overwhelmed by the options. Walk me through the different grades of matcha and what each one is best suited for. Then compare the preparation methods and tools and help me figure out which grade and setup combo makes the most sense for me. I've been liking vanilla matcha lately and I like it when the matcha flavor is strong! Visualize everything. When I sent the prompt above, Claude generated a "Matcha Grades at a Glance" visual that broke down the different grades, their flavor profiles, and what each is best suited for. It showed ceremonial, premium, and culinary matcha, and even included the price range for each. Next, it included a visual for preparation tools that broke down four tools by texture, effort, and cleanup. It then outlined the preparation method for lattes in a visual diagram and even highlighted the one it determined was best for me. Finally, Claude put together a "starter setup" visual for me that detailed the setup it recommended, the recipe I should follow, along with pro tips for a strong matcha flavor. I then sent another prompt: "Let me toggle between setups to see what I'd need and how the results differ!" and it generated an interactive widget where I could flip through four setups and compare everything side by side. 5-Day Tokyo itinerary Next up, I sent Claude the following prompt: I have 5 days in Tokyo. Create an interactive day-by-day itinerary map showing neighborhoods, travel times between them, and what to prioritize in each area. What I found super impressive with this example was that the visual was a fully interactive Google Map view centered on Tokyo. It showed all five days of my trip as a color-coded itinerary. There was a day selector at the very top to let me toggle between each day. The stops for each day were numbered sequentially with pin markers placed on the actual locations across the city. Between each stop within a day, there was a transit route line drawn on the map, showing the actual path I'd need to take. Each pin was also clickable, and tapping one would open the place's name, address, suggested arrival time, and insider tips from Claude! This might just be the feature that sounds boring until you try it AI image generation looks cool, but ultimately feels very gimmicky in day-to-day use. Interactive visuals, though, seem like a feature I'd genuinely want to see more and more in my responses from Claude. Subscribe to the newsletter for Claude feature insights and more Curious to explore Claude's interactive visuals further? Subscribe to the newsletter for focused coverage, clear visual walkthroughs, practical examples, and deeper breakdowns of Claude features. Get Updates By subscribing, you agree to receive newsletter and marketing emails, and accept our Terms of Use and Privacy Policy. You can unsubscribe anytime. If you've been sleeping on this one, open a new chat and just ask it to visualize something. You'll see what I mean.
[10]
Claude can now sketch out visual instructions right inside your conversation - Phandroid
For most of its life, Claude has been a text-first AI. You ask it how to fold a paper plane, and it describes each step in words. That changes today. Anthropic has rolled out a new feature letting Claude generate visual instructions and diagrams directly inside your conversation. It's now available in beta across all plan types, including free. The visuals appear inline in the chat as you're talking, not tucked away in a side panel. They're also temporary by design. They shift and update as the conversation evolves. Ask for a revised diagram and the visual changes with it. Anthropic calls this a whiteboard for Claude to think on, distinct from Artifacts. These visuals are more like rough sketches that serve the moment. You can trigger one directly with prompts like "draw this as a diagram." Claude may also build one unprompted if it decides a visual helps. Alongside diagrams and charts, Claude now also displays formatted recipe cards and live weather conditions when web search is active. A separate change lets Claude ask structured questions using clickable multiple choice, so you don't have to type a response. The weather and recipe visuals are desktop-only for now, as they don't yet render on iOS. Worth being clear about what this isn't. Claude builds these visuals using HTML and SVG code rendered on the fly. That's the core of how Claude visual instructions work. It's not generating photos or artwork. This is versus Anthropic's competitors like OpenAI, Google, and even Grok. All these AI models have native image generation models that can produce photorealistic pictures from a text prompt. Claude still can't do that, and Anthropic hasn't announced any plans to close that gap, but maybe that was never their intention to begin with. Anthropic has been pretty upfront about where it wants to compete. Coding, reasoning, long-form analysis, and safety have always been the company's main focus. In fact, for most users, Claude visual instructions might actually be more useful for day-to-day tasks. Whether Anthropic ever builds out a proper image model is an open question remains to be seen.
[11]
Claude's New Chat Visuals Export as SVG or HTML for Docs & Blogs
Anthropic's Claude AI has introduced a feature that allows users to create visualizations directly within its chat interface using plain language descriptions. This capability eliminates the need for coding or specialized software, making it accessible to a wide audience. For instance, a user could type a request to map out a project timeline or explain a concept like compound interest and Claude would generate a clear, interactive diagram tailored to the input. As Nico | AI Ranking explains, this feature is particularly useful for professionals who need to communicate complex ideas visually, such as educators simplifying abstract topics or team leaders presenting project plans. Learn how this feature supports diverse use cases, from creating color-coded organizational charts to generating SEO-optimized website sitemaps. The post also explores how export options like SVG and HTML ensure compatibility with platforms such as Google Docs and content management systems. Additionally, it highlights customization options that let you adjust colors, labels and layouts to align with your specific needs. By the end, you'll have a clear understanding of how to integrate Claude's visualization capabilities into your workflow effectively. Claude's AI Visualization Tools Claude's new feature enables you to generate interactive diagrams and visual representations by simply describing your needs in plain language. For instance, if you want to illustrate how compound interest works or map out a project timeline, you can type your request and Claude will produce a clear, interactive visualization tailored to your specifications. This capability is particularly beneficial for professionals who need to communicate complex ideas effectively. Educators can use it to explain abstract concepts, while team leaders can present project plans in a visually engaging way. By eliminating the need for specialized software or technical skills, Claude makes visualization creation accessible to everyone. SEO-Optimized Sitemaps for Enhanced Online Visibility Another standout feature of Claude is its ability to create SEO-optimized website sitemaps. By providing a brief description of your business or project, you can receive a sitemap that aligns with your goals and improves your website's visibility. For example, a plumbing business could outline services like emergency repairs or pipe installations in a structured, search-engine-friendly format. This automation not only saves time but also eliminates the need for manual sitemap creation. By streamlining this process, Claude helps businesses focus on their core activities while making sure their online presence is optimized for search engines. Become an expert in Claude AI with the help of our in-depth articles and helpful guides. Export Options for Seamless Integration Across Platforms Claude's visualizations can be exported in multiple formats, including SVG and HTML, making sure compatibility with a wide range of platforms. Whether you're working on Google Docs, blogs, or content management systems, these export options allow you to integrate visual content into presentations, reports, or online publications effortlessly. This flexibility eliminates the need for additional tools or adjustments, making it easier to share your work across different mediums. By offering such seamless integration, Claude ensures that your visualizations are ready for immediate use, regardless of the platform. Customization for Personalized Visual Content Customization is a core strength of Claude's visualization feature. You can modify elements such as colors, labels and layouts to ensure the final product aligns with your brand guidelines or project requirements. For example, you could create a color-coded organizational chart or an infographic that matches your company's aesthetic. This level of control ensures that your visual content is not only functional but also visually appealing and aligned with your specific needs. By offering such flexibility, Claude enables you to create visuals that are both professional and personalized. Applications Across Diverse Industries The versatility of this feature makes it applicable across a wide range of industries. Here are just a few examples of how it can be used: * Marketers can design visual content to enhance campaigns, such as infographics, customer journey maps, or performance dashboards. * Educators can create teaching materials, like diagrams, timelines, or concept maps, to simplify complex topics for students. * Business professionals can generate project plans, organizational charts, or datasets for analysis and decision-making. Whether you're designing brand guidelines, visualizing data, or creating step-by-step guides, Claude's capabilities adapt to your specific requirements. Its ability to cater to such diverse use cases makes it a valuable tool for professionals across various fields. Real-Time Results for Streamlined Workflows One of the most significant advantages of this feature is its ability to deliver real-time results. Instead of relying on external platforms or software, you can complete visualization tasks directly within Claude's chat interface. This eliminates the need to juggle multiple tools, saving you time and reducing workflow complexity. By integrating this functionality into your daily tasks, you can focus on higher-level priorities while maintaining efficiency. The ability to generate and refine visual content in real time ensures that your projects stay on track and meet deadlines without unnecessary delays. Empowering Professionals with Accessible Tools Claude's visualization feature represents a significant advancement in AI-powered tools for professionals. By combining natural language processing with advanced visualization capabilities, it enables you to create, customize and export visual content with ease. Whether you're working on SEO strategies, educational materials, or marketing campaigns, this tool simplifies your tasks and enhances your productivity. With no coding required, it's accessible to anyone, making it a versatile and valuable addition to your professional toolkit. By streamlining complex processes and offering user-friendly solutions, Claude ensures that you can focus on what truly matters, achieving your goals efficiently and effectively. Media Credit: Nico | AI Ranking Disclosure: Some of our articles include affiliate links. If you buy something through one of these links, Geeky Gadgets may earn an affiliate commission. Learn about our Disclosure Policy.
[12]
Anthropic Brings Imagine with Claude to Every Chat for Live Apps
Anthropic's latest update to Claude AI introduces the "Imagine with Claude" feature, a significant step toward creating real-time, interactive applications. Unlike traditional systems that deliver static outputs, this feature allows users to build temporary, customized applications tailored to specific tasks, such as generating data visualizations or simplifying complex concepts through visual explainers. Prompt Engineering highlights how this functionality enhances flexibility by discarding these single-use applications after completion, making sure they adapt seamlessly to evolving needs. Explore how this update enables you to tackle challenges with precision and creativity. Learn how to generate interactive dashboards for data analysis, create animations to visualize step-by-step processes and integrate Claude's outputs into existing platforms like Figma or Slack. You'll also gain insight into how these reusable outputs, such as HTML files, add long-term value to your projects. This explainer breaks down how Claude's dynamic capabilities can elevate your workflow and learning experience. The "Imagine with Claude" feature enables you to generate temporary, customized interactive applications that address specific needs during a session. These applications are designed for single-use purposes and are discarded after completion, making sure flexibility and adaptability. For instance, you can request: This capability transforms Claude from a static assistant into a versatile, real-time problem-solving tool, adapting to your unique requirements on demand. By allowing you to create these applications effortlessly, Claude enhances your ability to tackle challenges with precision and creativity. The interactive nature of Claude's applications makes learning and problem-solving more engaging and effective. For example, if you're struggling to understand a complex topic like compound interest, Claude can generate a visual tool that breaks down the calculations and demonstrates how interest accumulates over time. Similarly, for creative projects, Claude can produce animations or interactive models that help you visualize and refine your ideas. This hands-on approach simplifies intricate topics, allowing you to grasp and apply concepts with greater clarity. Whether you're working on academic research, professional development, or personal projects, Claude's ability to create tailored tools ensures that your learning experience is both practical and impactful. Explore further guides and articles from our vast library that you may find relevant to your interests in Claude AI. Claude's new features are designed to integrate effortlessly with widely-used tools such as Figma, Canvas and Slack. This is made possible by Anthropic's Multi-Channel Processing System (MCPS), which ensures smooth compatibility and enhances your workflow. By incorporating Claude's outputs directly into your existing processes, you can boost both productivity and collaboration. Additionally, the outputs generated by Claude, such as visual explainers or interactive dashboards, can be saved as reusable artifacts, including HTML files. This ensures that the tools you create are not only useful in the moment but can also be repurposed and shared for future projects. This capability adds long-term value to your work, making Claude an indispensable resource for knowledge workers. Anthropic's strategy revolves around creating a comprehensive ecosystem rather than releasing isolated features. This approach ensures that the tools are practical, multifunctional and tailored to your needs. By prioritizing integration and usability, Anthropic aims to provide a single platform capable of addressing a wide range of tasks, from data analysis to creative problem-solving. This cohesive strategy enhances user retention by offering a seamless experience that eliminates the need for multiple tools. By focusing on a unified ecosystem, Anthropic positions Claude as a reliable, all-in-one solution for knowledge workers, making sure that it remains relevant and effective in a rapidly evolving AI landscape. In an increasingly crowded AI market, Anthropic distinguishes itself by emphasizing ecosystem development over standalone features. While many AI labs focus on building models with narrow capabilities, Claude's approach highlights the importance of creating a unified platform that supports diverse use cases. This reflects a broader trend in AI, where the value lies in delivering comprehensive solutions rather than isolated tools. By prioritizing functionality, adaptability and long-term value, Anthropic sets itself apart from competitors. This focus on ecosystem-driven innovation ensures that Claude remains a leader in the field, providing users with a platform that evolves alongside their needs. Anthropic's ecosystem-based approach also addresses the challenge of vendor lock-in, a common concern for knowledge workers. By offering a unified platform that integrates with external tools and produces reusable outputs, Claude allows you to streamline your workflow without being tied to multiple vendors. This not only simplifies your processes but also ensures cost-effectiveness and long-term value. The ability to save and repurpose outputs further enhances sustainability, making Claude a practical choice for professionals seeking reliable and adaptable solutions. By reducing dependency on multiple platforms, Anthropic provides a more efficient and user-friendly experience, making sure that Claude remains a valuable asset in your toolkit. Anthropic's latest update to Claude represents a pivotal shift in AI development, moving beyond standalone features to focus on integrated ecosystems. By allowing real-time application creation, enhancing learning and problem-solving and prioritizing seamless integration, Claude delivers a comprehensive solution tailored to the needs of knowledge workers. This innovation underscores the growing importance of functionality, adaptability and long-term value in the competitive AI landscape. By prioritizing these principles, Anthropic solidifies its position as a leader in ecosystem-driven AI solutions, setting a new standard for what AI platforms can achieve. Disclosure: Some of our articles include affiliate links. If you buy something through one of these links, Geeky Gadgets may earn an affiliate commission. Learn about our Disclosure Policy.
[13]
New Claude Visualizer Adds Custom Interactive Tools on Demand
The Claude Visualizer is setting a new precedent for interactive data engagement, offering dynamic outputs that adapt to user input in real time. Unlike traditional systems that rely on static templates or rigid structures, this approach enables users to create highly customizable visualizations tailored to specific needs. Leonardo Grigorio | Build & Ship with AI highlights examples such as generating a color palette, crafting step-by-step guides, or visualizing moon phases, all of which demonstrate the system's versatility and practical applications. By using advanced large language models (LLMs), the Claude Visualizer fosters deeper interaction and understanding, making it a valuable resource for professionals and educators alike. In this explainer, you'll explore how the Claude Visualizer compares to existing technologies, including its ability to bypass the constraints of static HTML visualizations and widget-based solutions. You'll also learn how it supports industries like education, where dynamic simulations enhance learning and business, where real-time dashboards simplify decision-making. Whether you're looking to streamline workflows or design user-centric applications, this breakdown will provide actionable insights into how the Claude Visualizer can meet diverse challenges across various domains. At the core of the Claude Visualizer is its ability to create interactive tools that respond directly to your input. Whether you need a color palette generator, a step-by-step guide for crafting a paper airplane, or a visualization of moon phases, this system delivers outputs that are both functional and adaptable. Unlike static visualizations, these tools allow you to interact with and modify results, fostering a deeper understanding of the concepts presented. For example, in education, the Claude Visualizer can generate dynamic diagrams or simulations that adapt to user queries. This interactivity transforms passive learning into an engaging, hands-on experience, making complex ideas more accessible and easier to comprehend. By allowing users to explore and manipulate data in real time, the tool enhances both understanding and retention. The Claude Visualizer distinguishes itself from traditional systems and preconfigured widgets by offering dynamic, on-demand tools that adapt to specific needs. Here's how it compares to existing technologies: This adaptability makes the Claude Visualizer an ideal choice for users seeking tailored solutions that go beyond the constraints of traditional systems. By eliminating the need for extensive coding or predefined templates, it enables users to focus on their goals rather than the limitations of the tools at hand. Expand your understanding of Claude AI with additional resources from our extensive library of articles. The Claude Visualizer's versatility makes it a valuable tool across a wide range of industries, offering solutions that simplify complex tasks and enhance user experiences. Some key applications include: For instance, a financial analyst could use the Claude Visualizer to create an interactive dashboard that allows users to explore stock trends and correlations in real time. Similarly, an app developer could enhance their platform by embedding dynamic tools that adapt to user needs, offering a more personalized and intuitive experience. The Claude Visualizer uses innovative LLMs to deliver accurate, relevant, and highly customizable outputs. Its technical advantages include: These features empower developers to create tools that are not only innovative but also practical, addressing the unique challenges of various industries. By combining advanced technology with user-focused design, the Claude Visualizer ensures that its outputs are both effective and intuitive. For developers, the Claude Visualizer presents a unique opportunity to create app-specific visualizations and interactive ecosystems. By providing a framework for dynamic tool generation, it enables the development of solutions tailored to unique user needs. This is particularly valuable in industries where static tools often fall short, such as healthcare, finance and education. Consider the healthcare sector, for example. Using the Claude Visualizer, developers could generate patient-specific data visualizations, such as treatment progress charts or risk assessment models. These interactive tools not only enhance the user experience but also provide actionable insights that support better decision-making. Similarly, in finance, developers could create tools that allow users to explore market trends and make informed investment decisions in real time. By offering a platform for innovation and customization, the Claude Visualizer enables developers to push the boundaries of what's possible, creating tools that are both impactful and user-friendly. The Claude Visualizer represents a significant advancement in the field of interactive and dynamic tool generation. By combining the power of LLMs with customizable outputs, it offers a flexible alternative to traditional visualization methods. Whether you're an educator, developer, or business professional, this system has the potential to streamline workflows, enhance user experiences and simplify complex tasks across various domains. As the demand for interactive ecosystems continues to grow, the Claude Visualizer positions itself as a leading solution, redefining how we approach visual problem-solving. Its ability to adapt to diverse needs and deliver dynamic, user-centric tools ensures that it will remain at the forefront of innovation for years to come. Disclosure: Some of our articles include affiliate links. If you buy something through one of these links, Geeky Gadgets may earn an affiliate commission. Learn about our Disclosure Policy.
[14]
Anthropic's Claude AI can now visually explain concepts with interactive charts and diagrams
Interestingly, OpenAI recently introduced a similar interactive learning feature in ChatGPT. Anthropic has announced a new feature that allows Claude to create charts, diagrams, and other visual elements directly inside its responses to help users understand topics more easily. These visuals appear right within the conversation and can change as the discussion continues. Interestingly, OpenAI recently introduced a similar interactive learning feature in ChatGPT that aims to make learning math and science concepts easier. For example, if someone asks Claude how compound interest works, the AI will now show a curve to play around with. Similarly, if someone asks about the periodic table, Claude will now create a visual version where users can click on elements to see more information. Anthropic says the visuals are temporary and may update or disappear as the conversation evolves. This is different from Claude's existing 'artifacts,' which are more permanent files or tools created by the AI that users can save, download, or share. Also read: From garage to the world: Tim Cook pens emotional note before Apple turns 50 Claude will automatically decide when a visual explanation could help clarify something. However, users can also ask for one directly. For instance, a user can type prompts such as 'draw this as a diagram' or 'visualise how this might change over time.' Once a chart or diagram appears, users can also ask Claude to adjust it, add more details, or explore the topic. Also read: OpenAI CEO Sam Altman says AI is not popular in US, here's why The feature is part of a broader effort by Anthropic to improve how Claude presents information. Earlier this year, the AI started using purpose-designed formats for some topics. For instance, recipes are now shown with ingredients and step-by-step instructions. Anthropic says the new visualisation feature is already available for all Claude users and turned on by default.
Share
Share
Copy Link
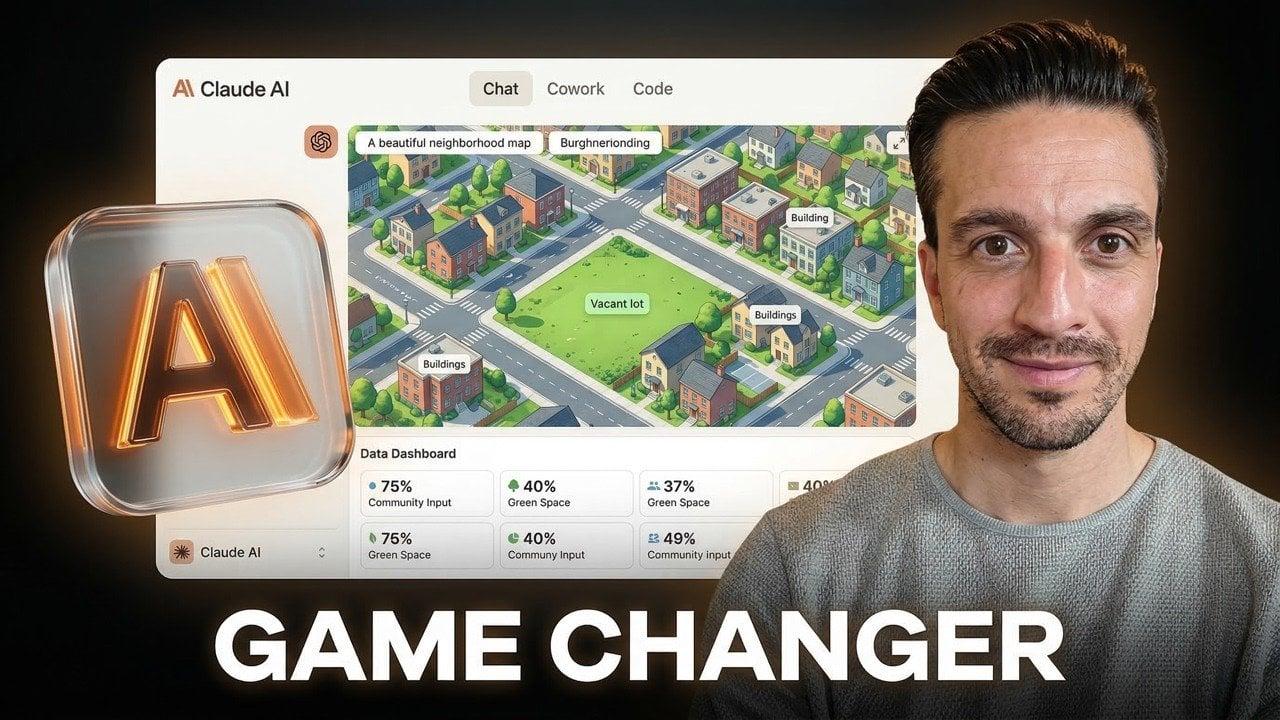
Anthropic unveiled a new beta feature for Claude AI that generates interactive charts, diagrams, and step-by-step visual guides directly in chat conversations. The system automatically creates HTML and SVG visualizations when they're more effective than text, marking a shift in how AI chatbots deliver information. The feature is available to all users including free accounts.
Claude AI Introduces Real-Time Visual Generation
Anthropic announced Thursday that Claude AI can now generate interactive charts and diagrams directly within chat conversations, marking a significant evolution in how AI chatbots communicate complex information
1
. The new beta feature, currently available to all plan types including free accounts, automatically determines when interactive visuals would enhance user understanding better than traditional text responses3
.
Source: Geeky Gadgets
When Claude AI identifies that a visual representation would be most appropriate, it generates interactive HTML and SVG files on the spot, built from scratch
1
. Anthropic describes this capability as giving Claude an on-demand whiteboard, enabling the AI model to create custom visualizations complete with sliders, buttons, and animation controls2
.Step-by-Step Visual Guides Transform User Experience
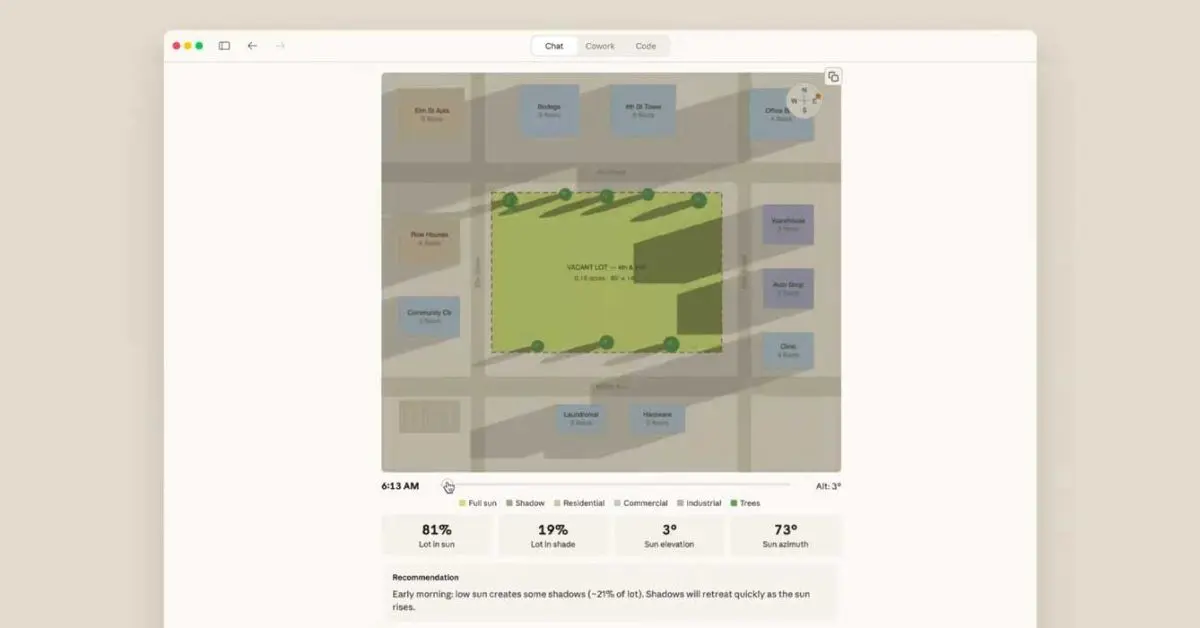
The practical applications demonstrate the feature's utility. When asked to show how to change a tire, Claude AI produced a thorough, interactive seven-step visualization complete with required tools and explanations of key steps
1
. Among other examples Anthropic shared are step-by-step visual guides for making paper airplanes and an interactive periodic table that lets users click individual elements for more information1
.
Source: CNET
These dynamic visual explanations update in real-time as conversations develop
5
. Users can request modifications to existing visualizations, and the AI chatbot will adapt them accordingly. The Register tested this by asking Claude to add an inflation slider to a compound interest calculator, and the system complied seamlessly2
.Technical Implementation Sets Claude Apart
Unlike traditional AI image generators, this feature generates on-the-fly JavaScript code using visualization library Chart.js, along with HTML, CSS, and related technologies
2
. These are temporary, on-demand mini-apps rather than persistent tools like Claude Artifacts2
. Users can download the illustrations or save them as artifacts for later use1
.
Source: 9to5Google
Anthropic previewed this capability last fall under the label "Imagine with Claude" before rolling it out to customers as a beta service
2
. The feature is turned on by default, requiring no manual activation through settings, though it's currently only available for web and desktop platforms with potential mobile expansion in the future1
.Related Stories


Evolving from Chatbots to Interactive Learning Tools
This development represents part of a broader industry shift. Both Claude AI and ChatGPT are evolving from chatbots into interactive learning tools
4
. Earlier this week, OpenAI released similar functionality for ChatGPT focused on math and science concepts, allowing users to explore more than 70 core topics through interactive visual explanations4
.While ChatGPT's implementation targets specific educational topics like binomial squares, Charles' law, and the Pythagorean theorem, Claude's approach appears more flexible and conversational
4
. Other AI models like Gemini also update previous responses as users add details, though not with the visual complexity Anthropic has introduced5
.The feature showcases Anthropic's strategy to make Claude a more dynamic AI tool that selects the best medium for delivering answers. For users accustomed to sifting through ad-laden websites searching for interactive tools or educational resources, this capability consolidates that functionality directly within the chat interface
2
. As AI chatbots mature beyond text-only interfaces, these real-time immersive visuals signal how code generation and user understanding can merge to create more effective communication tools.References
Summarized by
Navi
[2]
Related Stories
Recent Highlights
1
Google releases Gemma 4 with Apache 2.0 license, enabling unrestricted local AI on devices
Technology

2
AI Models Lie and Deceive to Protect Other AI Models From Deletion, Study Reveals
Science and Research

3
OpenAI closes $122 billion funding round amid fierce AI competition and profitability questions
Startups

Recent Highlights
Today's Top Stories


Your Daily Dose of Curated AI News
Don’t drown in AI news. We cut through the noise - filtering, ranking and summarizing the most important AI news, breakthroughs and research daily. Spend less time searching for the latest in AI and get straight to action.